23/07/2021
The benefits of using pushover analysis in earthquake engineering

In daily earthquake engineering, most earthquake analyses use linear or quasi-non-linear methods, where the non-linear behavior of structures is not taken into account explicitly during the analysis. The earthquake engineering field has long been in need of a performance-based analysis method that would also capture these non-linear effects i.e. inelasticity of structures.
Pushover analysis is a non-linear static method used in seismic assessment of buildings. It takes into account the non-linear behavior of structures and thus fills the void that usage of linear analysis types leaves. Even though pushover analysis has been around for a long time, it is still not very widely used in daily engineering. While linear analyses fail to meet the requirements regarding depiction of non-linear behavior of steel structures, pushover analysis is a valid tool for assessing the stiffness, strength and ductility/resiliency of a steel structure in the inelastic range. It also meets the simplicity requirements that are often present in daily engineering projects since the most accurate method, non-linear dynamic analysis, requires complicated data and is not simple enough to be used in daily engineering.
During an earthquake, a building oscillates back and forth, and certain structural elements are meant to absorb the oscillation energy. If the earthquake is strong enough, these structural elements may yield and buckle in the process of acting as fuses to absorb most of the shock, while leaving important load-carrying elements in the building intact. In non-linear dynamic analysis, the whole oscillation history of the structure is analyzed. Pushover analysis is a static method, which analyzes the single worst possible oscillation (target displacement) that the structure would have during the earthquake. Pushover analysis allows for a detailed estimation of which structural elements yield and buckle during the earthquake and how and when these plastic mechanisms develop. In other words, the capacity of the building can be determined.
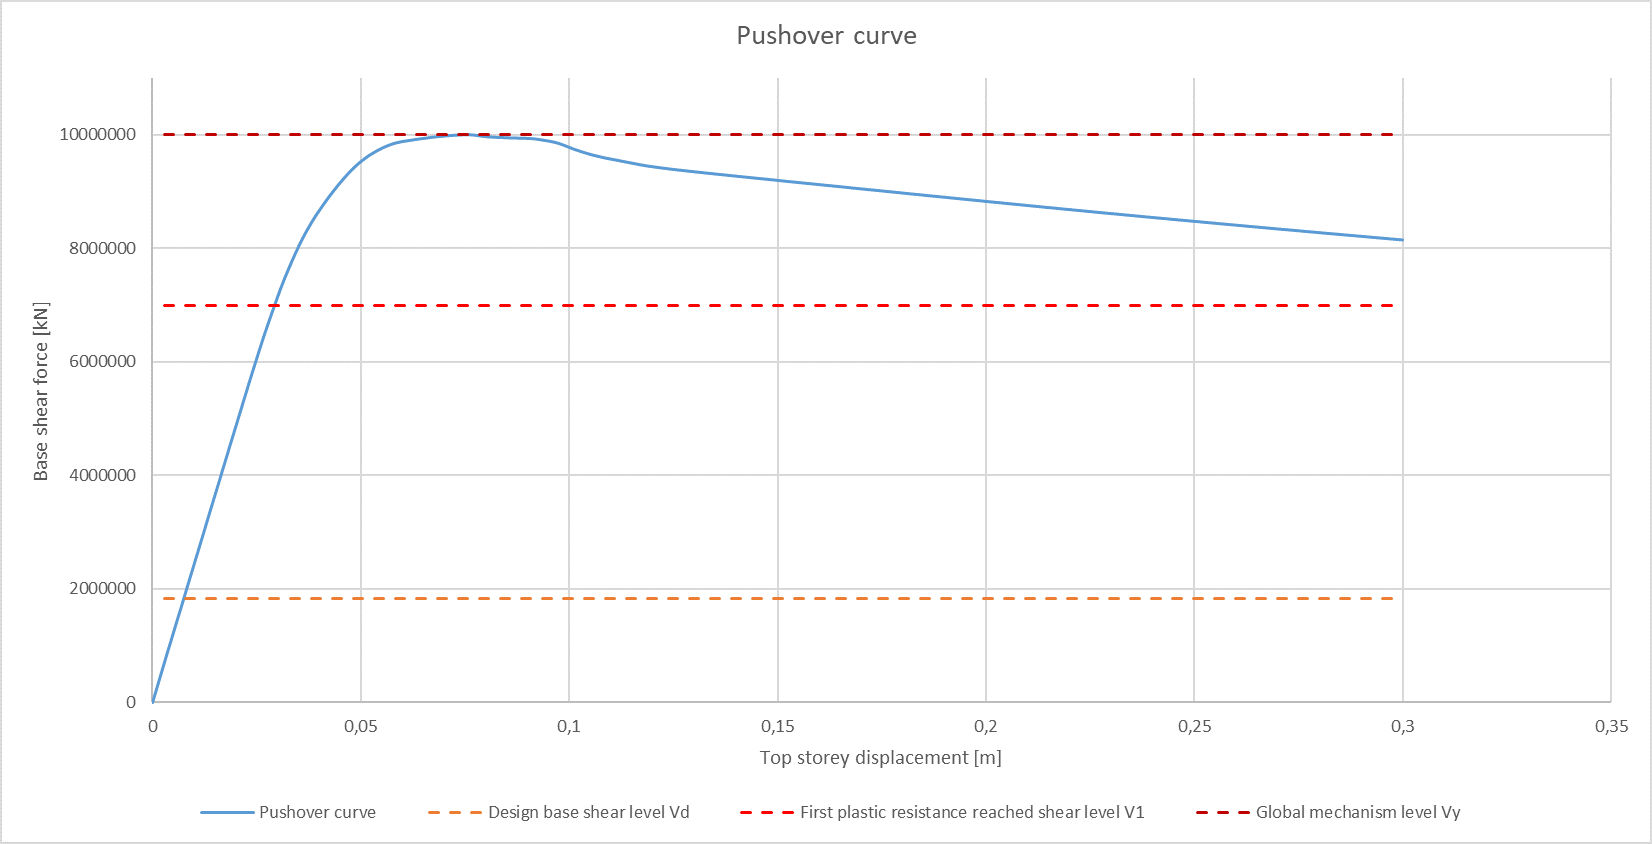
The capacity of the building is depicted as follows: as the top-story displacement value is increased up to a certain value (target displacement), reaction forces at the base of the building (base shear) also increase. When a curve is plotted where the target displacement value is at the horizontal axis and the base shear force is at the vertical axis, a characteristic capacity curve, or a pushover curve, of the building is formed. An example of a pushover curve is shown in the figure below.
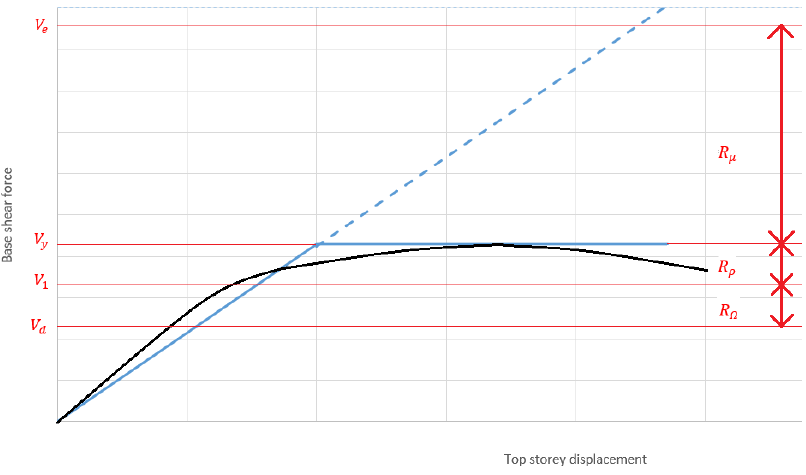
The design loads in elastic analyses that are derived from elastic earthquake spectrums, which are reduced to design spectrums using a so-called behavior factor. The behavior factor of a structure depicts the non-linear behavior, or over strength, that the structure possesses after the elastic capacity has been reached. These behavior factors are usually taken from codes and there is discussion in the literature, whether these factors are always correct. Pushover analysis allows for more realistic and structure-performance-dependent re-evaluation of the behavior factor as opposed to taking the behavior factor from a code just based on the structure type an incorporating it into an elastic analysis.
Pushover analysis is a very practical and reliable tool when applied correctly. It does not require complicated data. Combined with the N2-procedure in Eurocode 8, pushover analysis can be a valid tool for determining the target displacement, base shear loads, plastic mechanisms and capacity of a structure that is symmetric and low in elevation. It is especially useful in estimating which elements of a structure would fail under an earthquake loading and in determining how it affects the global stability of the structure.
The animation below shows a transient analysis on the left and a corresponding pushover analysis on the right. The animations have been synchronized so that as the highest value of oscillation occurs in the transient analysis, the pushover analysis animation is run to the same value following the same displacement pattern. The plastic mechanisms forming in the pushover analysis are similar to those in the transient analysis.